Lab · Hands-on Exercise
Head Rest Bed Sales Analysis
Connect sales data combined from multiple systems, perform field formatting, establish star schema data model relationships, calculate Total & Profit with DAX, and design an executive Power BI report page.
You are employed as a Sales Manager with Head Rest Bed Company. You have assembled sales information for two years from two different systems into a single combined table (
sales1). Now, you need to connect the dimension tables (Store, Product, Salesperson), set up data formatting, create DAX calculated columns for revenue and profitability, and build an interactive report dashboard.
Setup — Load the Data
Connect Power BI Desktop to both Excel files before starting the exercise tasks.
In Power BI Desktop, choose Home → Get Data → Excel Workbook and click Connect. Navigate to
SalesData.xlsx, select the table object named sales1, and click Load.
Click Get Data → Excel Workbook again, choose
Dimensions.xlsx, select all dimension table objects (Store, product, and salesperson), and click Load.
1
Task #1: Column Formatting
Format DateID as Date and RawMargin as Percentage
Select the
DateID column in the sales1 table. In the Column tools ribbon tab, change its Data Type / Formatting from Whole Number to Date.
Select the
RawMargin column in the sales1 table. In the Column tools ribbon tab, format it as Percentage (%).
2
Task #2: Data Modeling
Link dimension tables to the sales1 fact table in Model View
Switch to Model View in Power BI Desktop and create 1-to-many (1:*) active relationships between the tables:
- Link
Store[StoreID](1) tosales1[storeID](*) - Link
product[SKU](1) tosales1[productID](*) - Link
salesperson[SalesRepID](1) tosales1[SalespersonID](*)
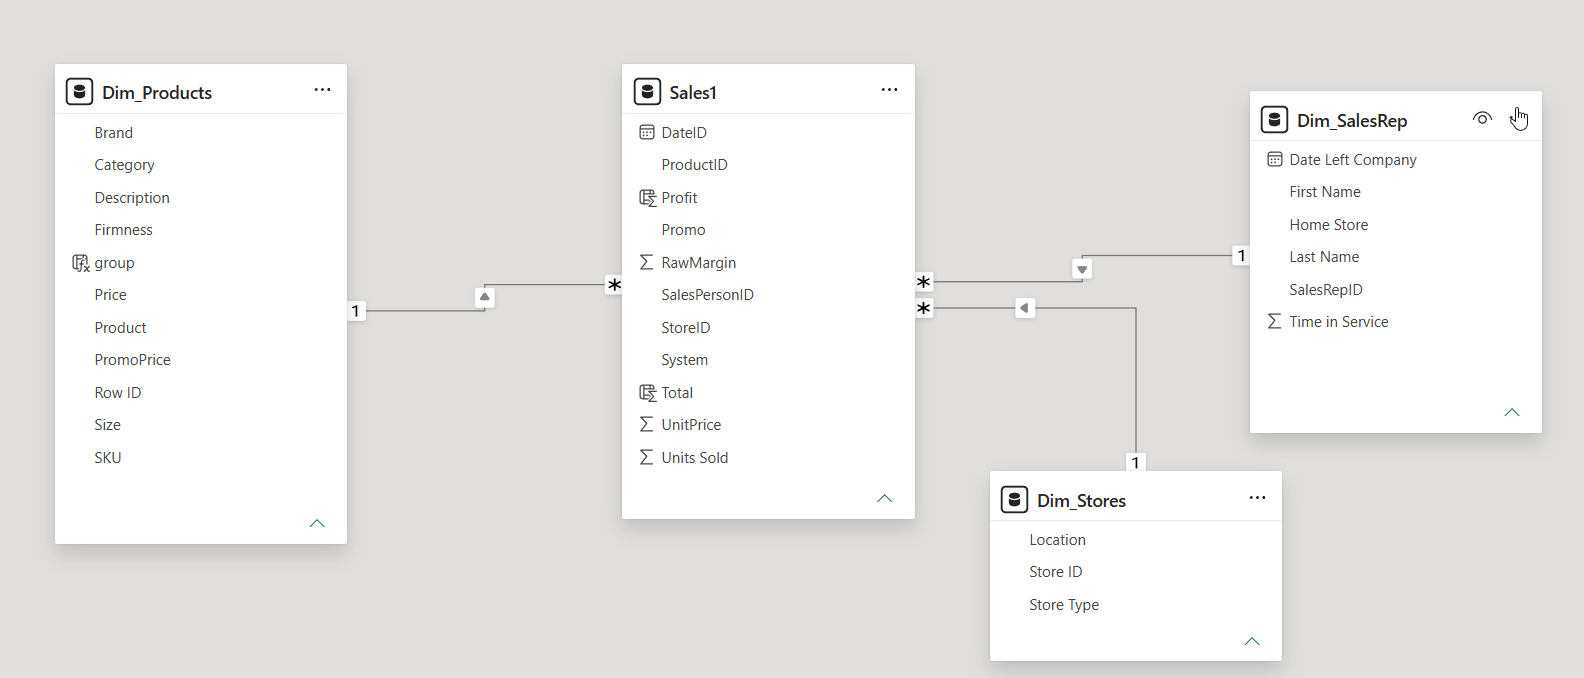
Model View: 1-to-many relationships connecting Store, Product, and Salesperson dimensions to the sales1 fact table.
3
Task #3: DAX Calculated Columns
Create Total Revenue and Profit calculated columns
Create a calculated column named
Total in sales1 by multiplying UnitsSold by UnitPrice:
Total = sales1[UnitsSold] * sales1[UnitPrice]
Create a calculated column named
Profit in sales1 by multiplying Total by RawMargin:
Profit = sales1[Total] * sales1[RawMargin]
4
Task #4: Visualizations & Report Design
Build the executive sales report page with slicers, cards, table, smart narrative, and line chart
Visualization #1 (Multi-Row Card KPI): Add a Multi-row Card visual on the right side of the page to display count of stores, count of products, and count of salespersons. Add an icon/image beside each value and align it to the bottom.
Visualization #2 (Filter Slicers): Add three Slicer visuals across the top for
Brand, Category, and Store Type. Insert line shapes to decorate and separate the space between them.
Visualizations #3 – #6 (Table, Summary Cards, Smart Narrative & Trend Line):
- Add a Table visual displaying
storeLocation,RawMargin,Total, andProfit. - Add a Multi-row Card visual to summarize overall
TotalandProfit. - Add a Smart Narrative visual next to the table to generate automated insight bullet points.
- Add a Line Chart visual showing quarterly trends for
TotalandProfitover time.
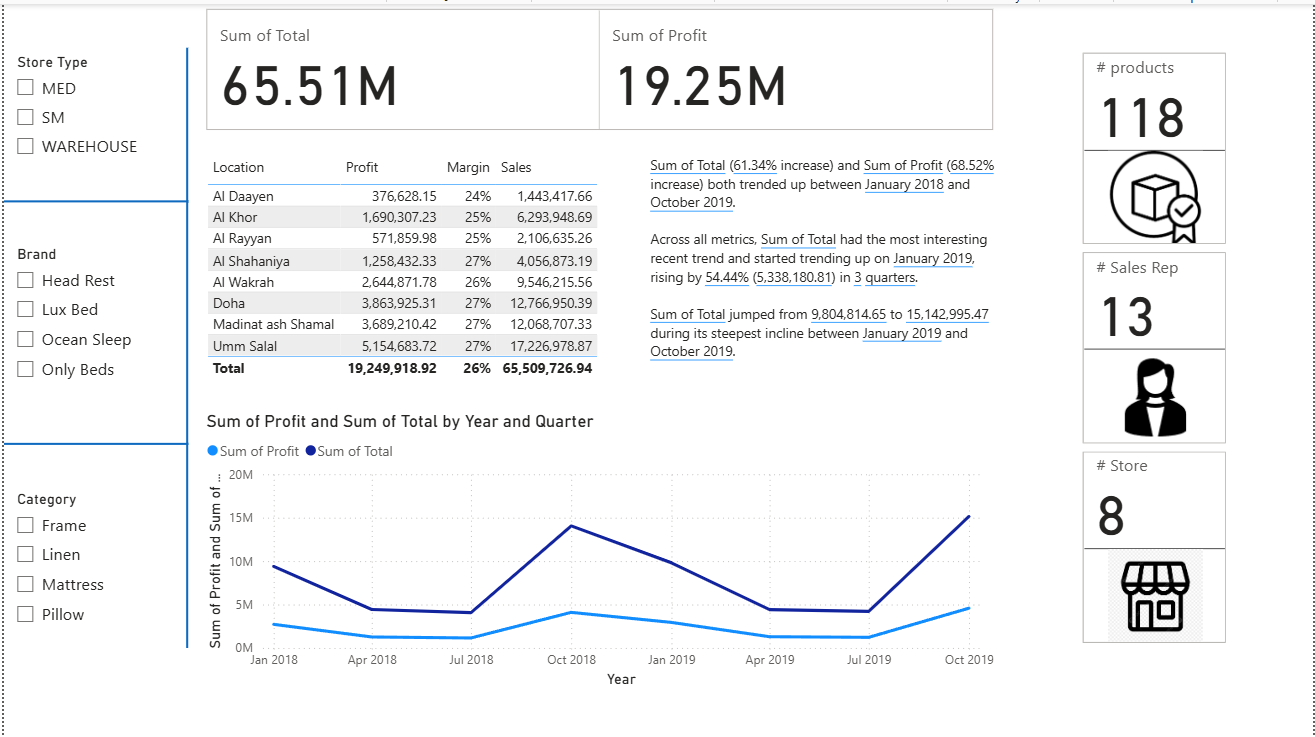
Final Report Page: Executive Head Rest Bed dashboard featuring slicers, multi-row KPI card, table, smart narrative summary, and quarterly trend line chart.