Lab Practice
Charts & Dashboards
Build a fully interactive, dynamic sales dashboard using raw transaction data. You will configure multiple side-by-side pivot tables, link them together with workbook-level slicers, generate professional charts, and implement a dynamic title and KPI block.
Practice & Solution Files
MOS Excel Expert — Objective 4.2
Interactive Dashboard Construction
Follow the steps below to build the backend summaries, link report connections, and model the visual charts.
1
Data Structuring & Backend Pivot Tables
Open
Create a new worksheet named
• Pivot Table A (Category Summary): Row:
• Pivot Table B (Salesperson Top 3): Row:
• Pivot Table C (Monthly Trend): Row:
• Pivot Table D (Product Top 5): Row:
Select one of the Pivot Tables, click PivotTable Analyze → Insert Slicer, and select
Right-click the slicer header → Report Connections..., and check the boxes next to all four Pivot Tables.
sales_chartsanddashboards - Questions.xlsx. Convert the raw sales dataset into an official Excel Table by clicking inside the range and pressing Ctrl + T.
Create a new worksheet named
Pivot Tables. Build four separate pivot tables side-by-side on this sheet:
• Pivot Table A (Category Summary): Row:
Category, Values: Sum of TotalPrice.
• Pivot Table B (Salesperson Top 3): Row:
Salesperson, Values: Sum of TotalPrice. Filter to the **Top 3** (Value Filters → Top 10 → 3) and sort descending by sum of total price.
• Pivot Table C (Monthly Trend): Row:
OrderDate (grouped by Month), Values: Sum of TotalPrice.
• Pivot Table D (Product Top 5): Row:
Product, Values: Sum of TotalPrice. Filter to the **Top 5** (Value Filters → Top 10 → 5) and sort descending by sum of total price.
Select one of the Pivot Tables, click PivotTable Analyze → Insert Slicer, and select
City Name.
Right-click the slicer header → Report Connections..., and check the boxes next to all four Pivot Tables.
2
Dashboard Assembly & Interactive Charts
Create a new worksheet named
Create four professional Pivot Charts from your pivot tables and place them on the Dashboard worksheet:
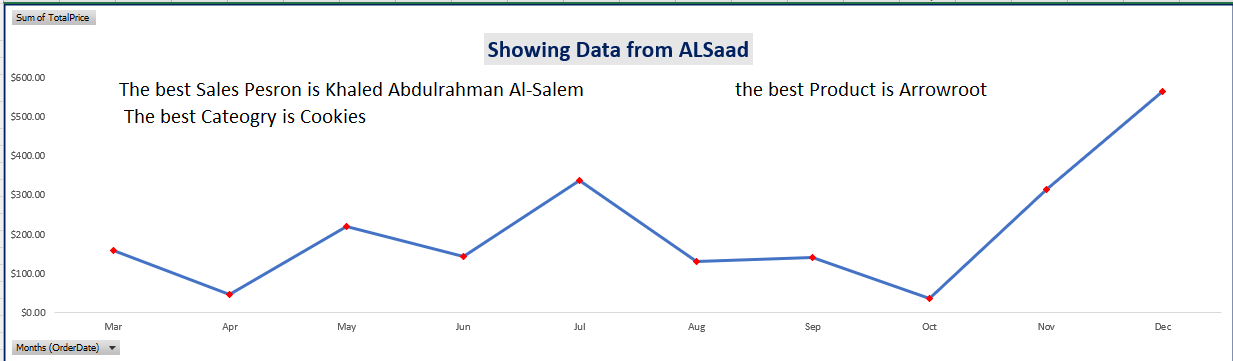
• Chart 1 (Monthly Sales Trend): Insert a Line Chart from the Monthly Trend pivot table.
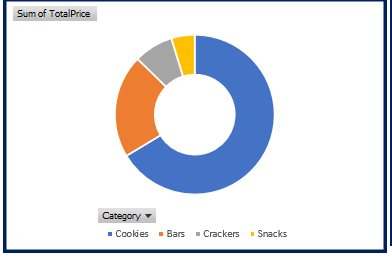
• Chart 2 (Category Breakdown): Insert a Pie Chart (or Doughnut Chart) from the Category pivot table.
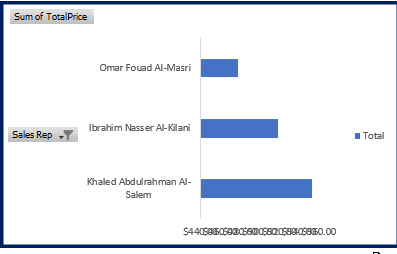
• Chart 3 (Salesperson Performance): Insert a Clustered Bar Chart from the Salesperson Top 3 pivot table.
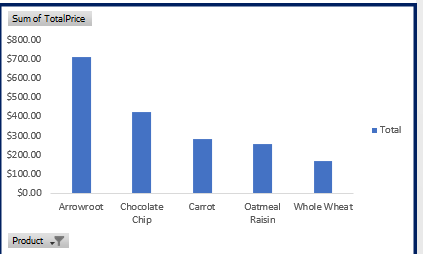
• Chart 4 (Product Popularity): Insert a Clustered Column Chart from the Product Top 5 pivot table.
Hide all field buttons on the charts (Right-click any button → Hide All Field Buttons on Chart) and clean up gridlines, axes, and legends for a premium design.
Dashboard. Highlight the grid and apply a light gray/sleek dark fill to create a clean canvas. Cut (Ctrl + X) and paste (Ctrl + V) the City Name Slicer to the Dashboard sheet.
Create four professional Pivot Charts from your pivot tables and place them on the Dashboard worksheet:
• Chart 1 (Monthly Sales Trend): Insert a Line Chart from the Monthly Trend pivot table.
• Chart 2 (Category Breakdown): Insert a Pie Chart (or Doughnut Chart) from the Category pivot table.
• Chart 3 (Salesperson Performance): Insert a Clustered Bar Chart from the Salesperson Top 3 pivot table.
• Chart 4 (Product Popularity): Insert a Clustered Column Chart from the Product Top 5 pivot table.
Hide all field buttons on the charts (Right-click any button → Hide All Field Buttons on Chart) and clean up gridlines, axes, and legends for a premium design.
3
Challenge: Dynamic Title & KPI Indicators
To turn your charts into a true application-like dashboard, complete the following challenges:
• Dynamic Line Chart Title: Create a helper cell formula that dynamically returns the selected city from the slicer (e.g.,
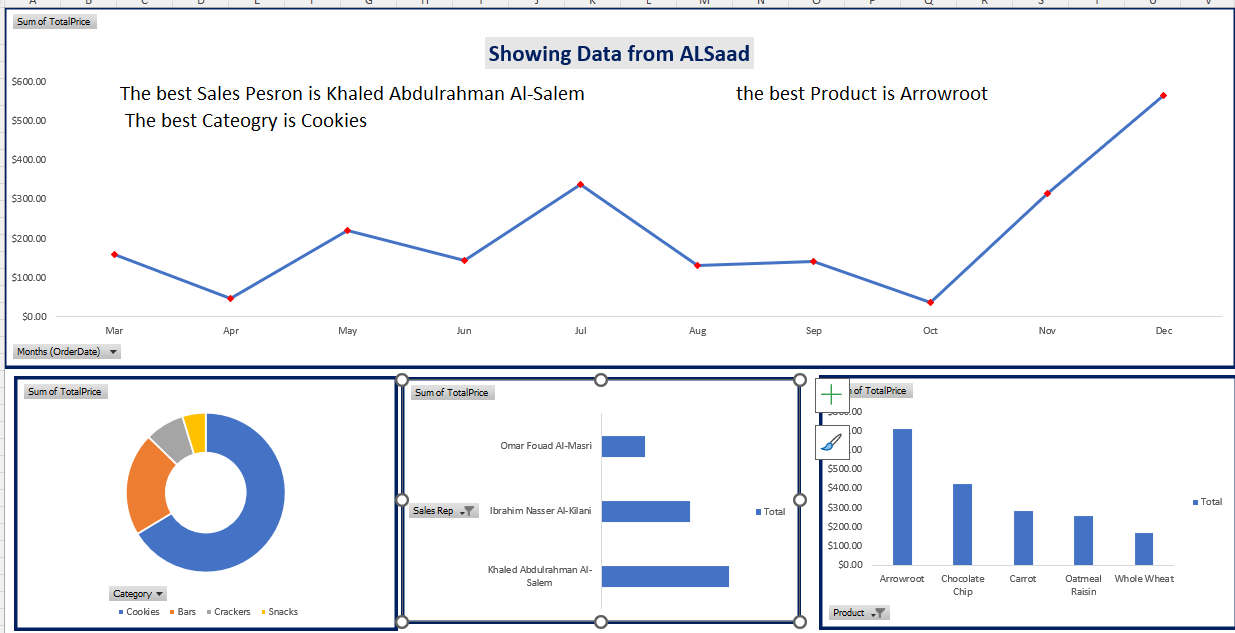
• Dynamic KPI Cards: In cell ranges near the top of your dashboard, write formulas that return the **Best Salesperson**, **Best Category**, and **Best Product** based on the currently filtered data. In the chart itself, display these KPIs as dynamic text callouts linked to those formula cells.
• Dynamic Line Chart Title: Create a helper cell formula that dynamically returns the selected city from the slicer (e.g.,
="Showing Data from " & C2 or using CUBEMEMBER / a helper Pivot Table cell). If no filters are selected, it must say Showing Data from All Cities. Link the Line Chart Title to this cell (click the chart title text box, type = in the formula bar, and select your helper cell).
• Dynamic KPI Cards: In cell ranges near the top of your dashboard, write formulas that return the **Best Salesperson**, **Best Category**, and **Best Product** based on the currently filtered data. In the chart itself, display these KPIs as dynamic text callouts linked to those formula cells.
Verify Dashboard Values: Unfiltered State (All Cities)
Make sure no slicer filter is active, and verify your totals match:
Unfiltered Dashboard Verification
Input raw numbers (e.g. 17988.66), tolerance: +/-0.02
| Item / Metric | Value |
|---|---|
| Cookies Category Total ($) | |
| Crackers Category Total ($) | |
| Top Salesperson Total (Mohammed Samer Al-Jabouri) ($) | |
| Top Product Total (Carrot) ($) | |
| Grand Total Sales ($) |
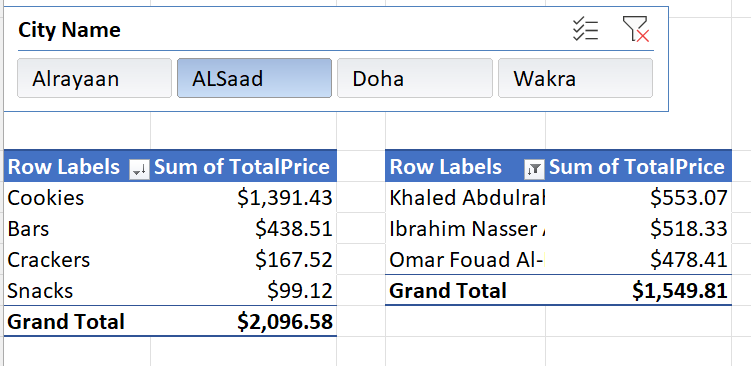
Verify Dashboard Values: Filtered State (ALSaad Slicer Active)
Select ALSaad in your City Name slicer, and verify the recalculated figures:
ALSaad Slicer Active Verification
Input raw numbers, tolerance: +/-0.02
| Item / Metric (Filtered) | Value |
|---|---|
| Cookies Category Filtered Total ($) | |
| Top Salesperson Filtered Total (Khaled Abdulrahman Al-Salem) ($) | |
| Top Product Filtered Total (Arrowroot) ($) | |
| Grand Total Filtered Sales ($) |
Completed Dashboard Preview