Lab 05 · Hands-on Capstone
WWI Sales & Profit Analysis
A comprehensive capstone lab using the Wide World Importers (WWI) sample dataset. Build a star schema model, implement custom date logic with DAX, and construct high-impact visualization dashboards featuring map drill-throughs and custom page tooltips.
You are employed as a Lead Data Analyst at Wide World Importers (WWI).
You have been tasked with loading transactional sales data and creating a dimensional star schema model. Trainees must clean columns, define calculations using DAX, build an interactive report, and integrate tooltips to answer key management questions.
1
Data Loading & Date Table
Load transaction records and construct date dimension table
Load the FactSale.csv file. Verify all column types, focusing on
Invoice Date Key.
Create a calendar table using DAX. Under Modeling ribbon, click New Table and write:
DateTable = ADDCOLUMNS(
CALENDAR(DATE(2013,1,1), DATE(2016,12,31)),
"year", YEAR([Date]),
"month", MONTH([Date]),
"Q", CONCATENATE("Q", QUARTER([Date])),
"Month name", FORMAT([Date], "mmmm")
)
CALENDAR(DATE(2013,1,1), DATE(2016,12,31)),
"year", YEAR([Date]),
"month", MONTH([Date]),
"Q", CONCATENATE("Q", QUARTER([Date])),
"Month name", FORMAT([Date], "mmmm")
)
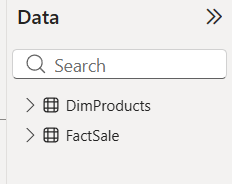
FactSale loaded and DateTable defined in the data model.
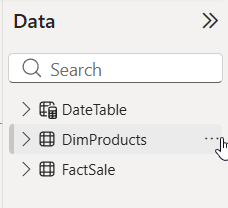
Verification of the newly created DateTable with calculated columns.
Right-click
DateTable in the Fields pane, select Mark as date table, and choose the [Date] column as the unique key.
Establish a relationship between
DateTable[Date] and FactSale[Invoice Date Key].
Go to File → Options and settings → Options → Data Load (Global or Current File) and disable Auto date/time to keep the model clean.
2
DAX Calculated Columns
Define financial logic directly inside the Fact table
Add a calculated column total before tax on the
FactSale table:
total before tax = FactSale[Quantity] * FactSale[Unit Price]
Add a calculated column Tax based on total before tax and tax rate:
Tax = FactSale[total before tax] * FactSale[Tax Rate]
Add a calculated column total after tax:
total after tax = FactSale[total before tax] + FactSale[Tax]
Add a calculated column profit (Total before tax minus cost of goods sold):
profit = FactSale[total before tax] - FactSale[COGs]
Extract the invoice month name via DAX calculated column:
month (DAX) = FORMAT(FactSale[Invoice Date Key], "mmmm")
3
Products Dimension Table
Establish relationships and build the first report page
Load the products dimension table from Dimproducts.xlsx.
Connect the two tables: drag a relationship line from
Dimproducts[Item] (or matching product code) to FactSale[Description].
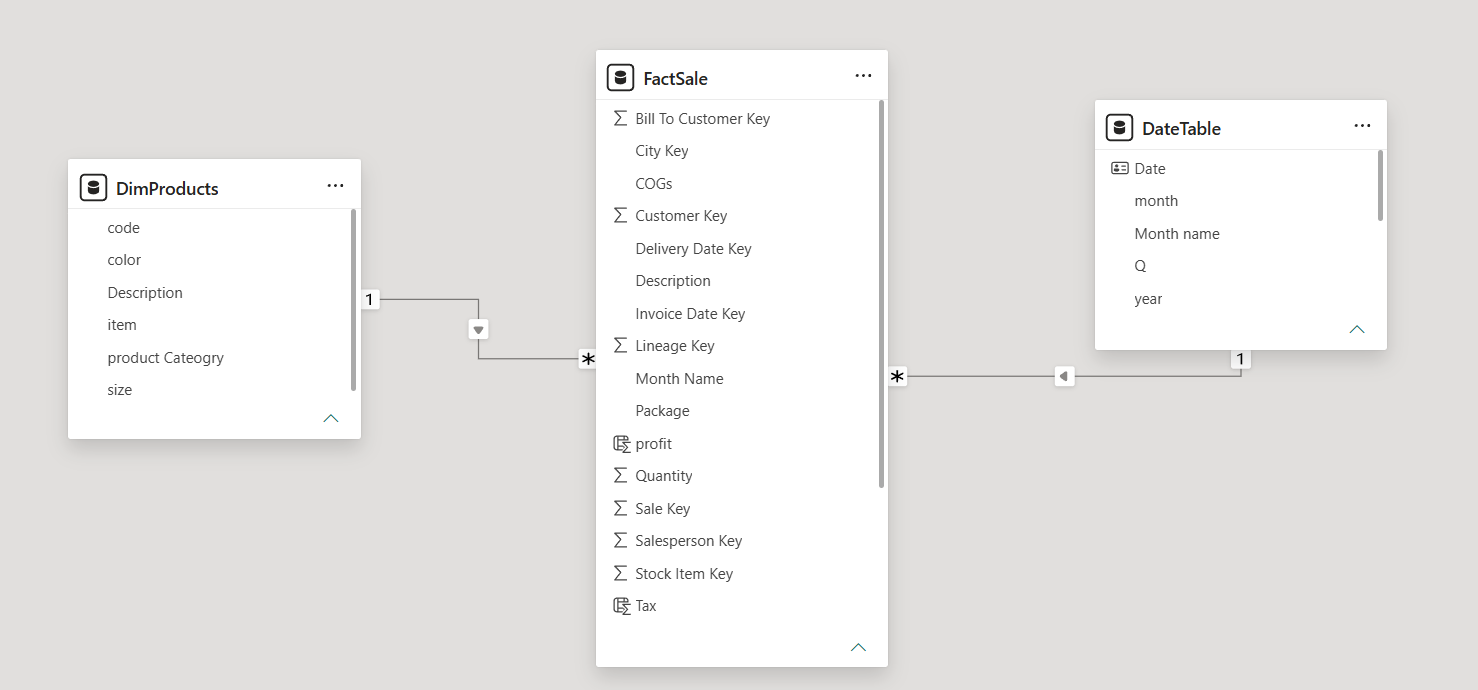
Creating and verifying the relationship between Dimproducts and FactSale.
On your first report page, insert a **Multi-card** visual. Populate it with
profit, total before tax, and Tax.
Add a **Table** visual containing two columns:
Item (from Dimproducts) and profit (from FactSale).
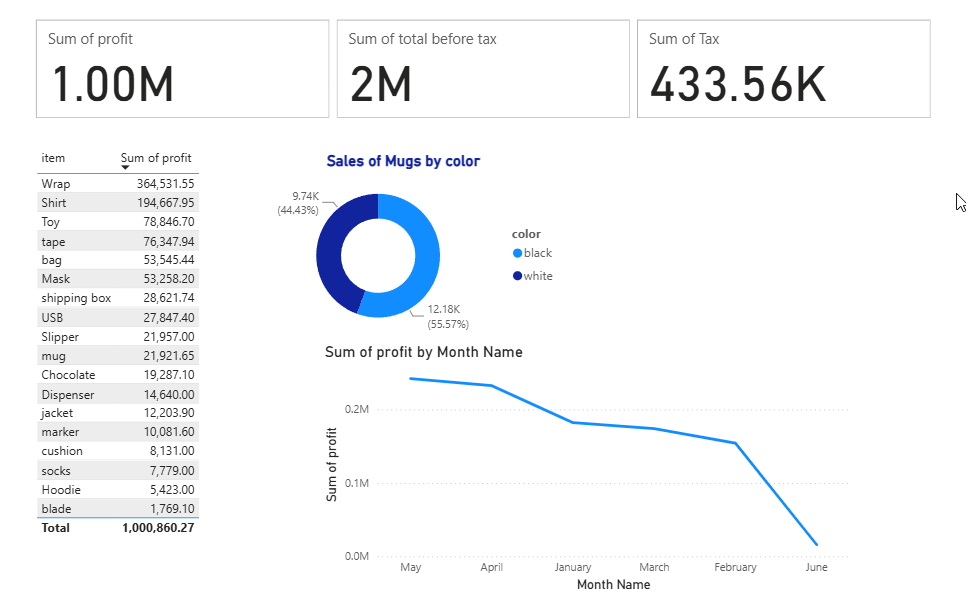
Initial report layout featuring a multi-card and product profit breakdown table.
4
Visualization - Charts
Compare products and show historical trends
Add a Donut Chart displaying mug sales. Configure it to display the profit difference between white and black mugs specifically (filter visual-level values).
Add a Line Chart showing the trend of
profit by month (DAX) (from FactSale).
💡 Challenge: Sorting Month Names Chronologically
Problem: The line chart is not sorted chronologically by month. If you sort the chart by month (DAX), Power BI sorts it alphabetically (e.g., April will be the first one, then August, December, etc.).
Challenge: How do you sort month (DAX) keeping the correct chronological order of the months?
💡 Reveal Solution
- Create another calculated column for month number on the
FactSaletable:FactSale[month number] = FORMAT(FactSale[Invoice Date Key], "m") - Select the original
month (DAX)column in the Fields list. - Go to the Column Tools tab in the ribbon, click Sort by Column, and choose
month numberfrom the list.
5
City Dimension & Mapping
Geographical branch distribution across Arab countries
Load the city dataset from DimCity.xlsx.
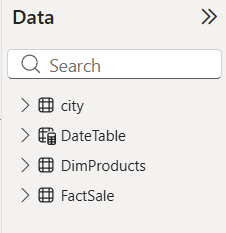
DimCity added to the model, expanding the geographic layout (4 tables total).
Confirm/build the active relationship linking
DimCity[City Key] to FactSale[City Key].
Create a **Map page**. Add a Map visual plotting
City location with profit mapped to bubble size.
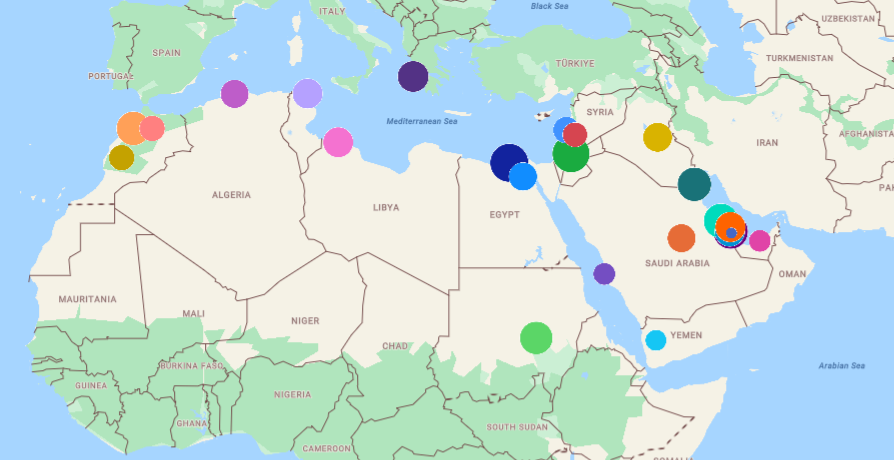
The Map visual plotting branch profit sizes across regions.
Drag
City into the Legend bucket, and format the Map legend position to display in the Right Center of the canvas.
6
Employee Information & Top 10 Filters
Track salesperson performance and set dynamic headings
Load the employee staff lookup table from DimEmployee.xlsx.
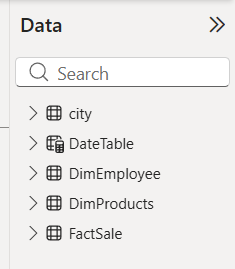
DimEmployee lookup loaded into the dimensional schema (5 tables total).
Create a relationship connecting
DimEmployee[Employee Key] to FactSale[Salesperson Key].
Create a new report page containing two separate tables side-by-side:
- Table 1: Salesperson name (Employee) and Sum of Profit
- Table 2: Item and Sum of Profit
Apply a **Top N filter** on both visual elements (in the Filters pane) to restrict output: show only the Top 10 items based on
Sum of Profit.
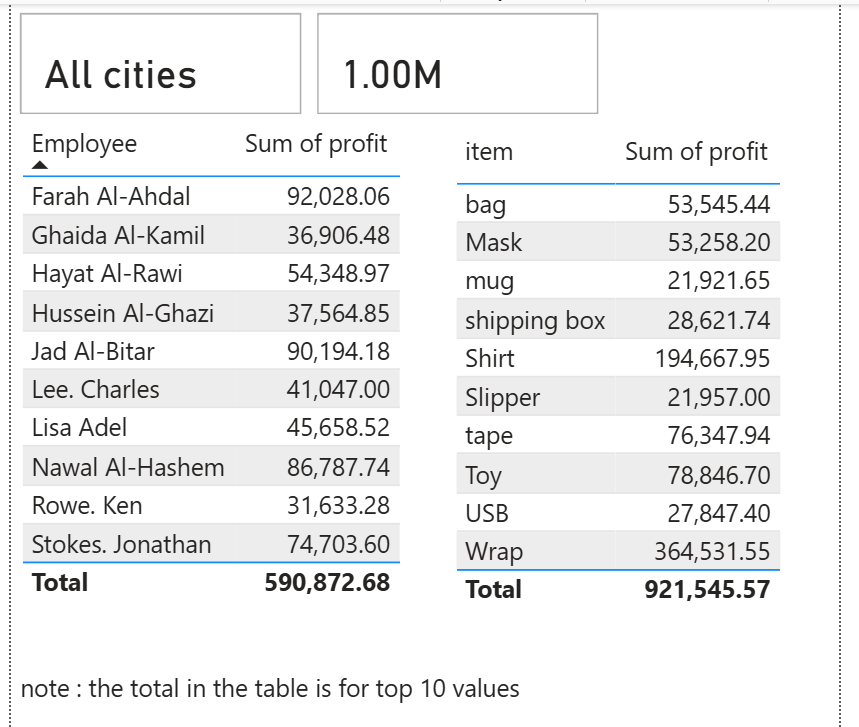
Salesperson and item tables filtered to display only top 10 performance list.
Create a DAX measure that dynamically changes headings. If exactly one city is selected via a slicer, show that city's name; otherwise, display
"all cities".
SelectedCityName = IF(HASONEVALUE(DimCity[City]), VALUES(DimCity[City]), "all cities")
Add a multi-row card displaying
SelectedCityName and total profit on this page to test the dynamic behavior.
7
Custom Tooltips
Enrich the map hover state with custom visual reports
Create a new blank page. Go to Page Information and toggle **Use as tooltip** to On. Set Page Size option to Tooltip.
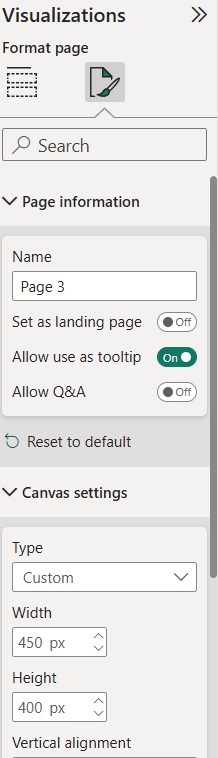
Configuring page property settings to serve as a custom Tooltip overlay canvas.
Navigate back to the Map visual on your Map page. Select the visual, go to the Format pane → General → Tooltips, change Type to Report page, and set Page to the tooltip page.
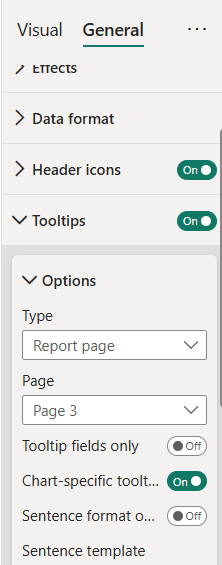
Linking the map visual to render our tooltip page during hovers.
Confirm hover tooltips are working correctly by hovering over any city bubble.
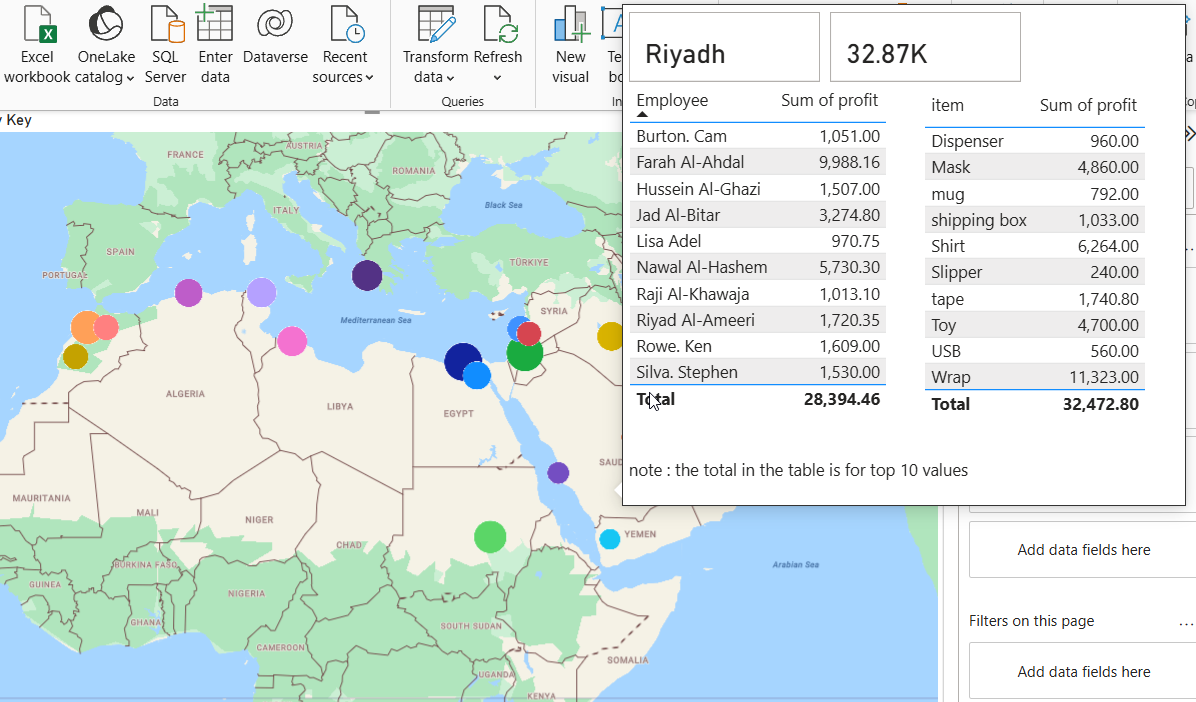
Hover validation displaying customized visual details over the map bubbles.
Right-click the Tooltip page tab at the bottom and select Hide Page to keep the final published report tidy.
DAX Reference Guide
Quick reference list containing all calculated column and table formulas used throughout the Wide World Importers lab exercise.
profit
Task 2 · Calculated Column
FactSale[profit] = FactSale[total before tax] - FactSale[COGs]
Tax
Task 2 · Calculated Column
FactSale[Tax] = FactSale[total before tax] * FactSale[Tax Rate]
total before tax
Task 2 · Calculated Column
FactSale[total before tax] = FactSale[Quantity] * FactSale[Unit Price]
total after tax
Task 2 · Calculated Column
FactSale[total after tax] = FactSale[total before tax] + FactSale[Tax]
month (DAX)
Task 2 · Date Formatting
FactSale[month (DAX)] = FORMAT(FactSale[Invoice Date Key], "mmmm")
month number
Task 4 · Challenge Sorting
FactSale[month number] = FORMAT(FactSale[Invoice Date Key], "m")
DateTable
Task 1 · Calculated Table
DateTable = ADDCOLUMNS(
CALENDAR(DATE(2013,1,1), DATE(2016,12,31)),
"year", YEAR([Date]),
"month", MONTH([Date]),
"Q", CONCATENATE("Q", QUARTER([Date])),
"Month name", FORMAT([Date], "mmmm")
)
CALENDAR(DATE(2013,1,1), DATE(2016,12,31)),
"year", YEAR([Date]),
"month", MONTH([Date]),
"Q", CONCATENATE("Q", QUARTER([Date])),
"Month name", FORMAT([Date], "mmmm")
)
SelectedCityName
Task 6 · Dynamic heading
SelectedCityName = IF(HASONEVALUE(DimCity[City]), VALUES(DimCity[City]), "all cities")