Topic 02 — Create a Report Page
Topic Two

Create a Report Page

We start with a real sales dataset from Excel, connect it directly into Power BI, and build a complete report page — asking business questions and choosing the right visual to answer each one.


Step 1 — Connect & Load

The dataset is a single Excel table called Sales. The data is already clean, so we connect and load directly — no transformations needed.

1
Get Data → Excel Workbook
Home tab → Get Data → Excel Workbook → locate the sales file
Sales.xlsx Connect
2
Select the Sales table
In the Navigator window, check the Sales table — preview confirms the data looks correct
Preview
3
Click Load (not Transform)
Data is clean — skip Power Query and load directly into the model
Prepare skipped

A quick tour of the Power BI Desktop interface after loading the data.


Step 2 — Check Data Types

Before building any visual, confirm that Power BI has correctly detected each column's data type. Wrong data types are the most common source of errors in reports.

123
Whole Number
Counts, quantities, IDs — no decimal places.
Quantity: 5
1.2
Decimal Number
Prices, totals, percentages — values with decimal precision.
Price: 249.99
ABC
Text
Names, categories, labels — not used in calculations.
City: "Riyadh"
📅
Date / Time
Enables time intelligence — year, month, quarter filters.
Date: 2023-04-15
T/F
True / False
Boolean flags — yes/no, active/inactive fields.
IsReturned: True

Step 3 — Ask Questions, Choose Visuals

Every visual should answer a specific business question. We start by writing the questions first, then decide which visual type answers it best.

What is the total price?
Card
How many cities are in the dataset?
Card
Breakdown of total price by city
Table Clustered Column
Breakdown of total price by year
Line Chart
Breakdown of total price by branch
Donut Chart

The Report Page

Here is how the completed report page looks — all five questions answered with the right visuals, arranged on a single page.

Completed sales report page in Power BI Desktop

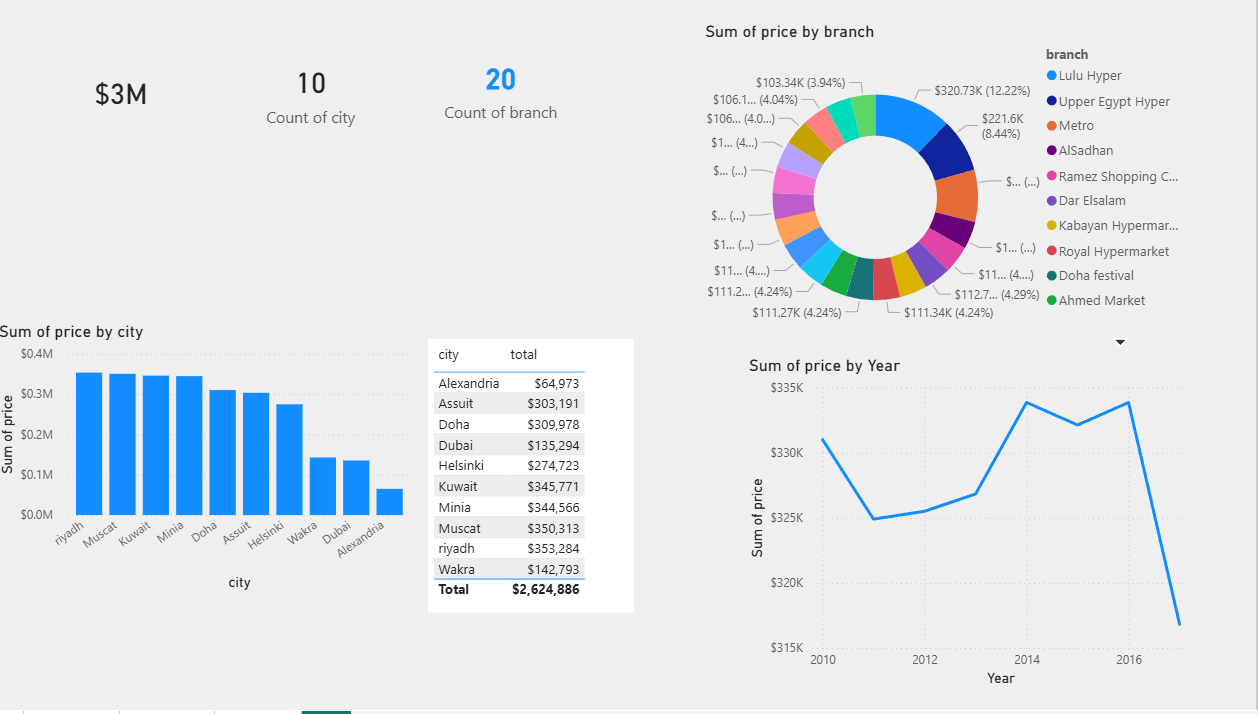
The completed report page — Cards, Table, Clustered Column, Line, and Donut visuals.

© 2025 askfarouk.net · Ahmed Farouk Microsoft Certified Trainer · Doha, Qatar